APPLICATION
A metrology lab would like to monitor the waste stream (water) from an Ion Chromatograph (IC) with a high/low alarm and local display for the lab technician. Ion chromatography is a form of liquid chromatography that uses ion-exchange resins to separate atomic or molecular ions based on their interaction with the resin. IC is used in
many industries such as Agriculture, Biotech, Environmental, Forensic, Mining, Pharmaceutical, Petroleum, Semiconductor and Water Treatment to analyze contaminants, organic/inorganic compounds, carbohydrates, amino acids, corrosive ions and quality control of finished products. The IC must have a constant flow of sample liquid, typically 0.5mL/minute. A flow restriction, crimped tubing for example, could cause flooding of mini cell membranes while other components run dry.
MCMILLAN PRODUCTS UTILIZED
M109-010-VDC5 Liquid FLO-SENSOR
250 Multifunction Display
250-11 Alarm Output Card
DESCRIPTION
The McMillan Model M109 Micro Flo-Sensor will precisely measure virtually any fluid as low as 0.05mL/minute. McMillan Multifunction Displays have many features. When combined with the optional Alarm Output Card, they can be used to perform high/low alarm functions.
OPERATION
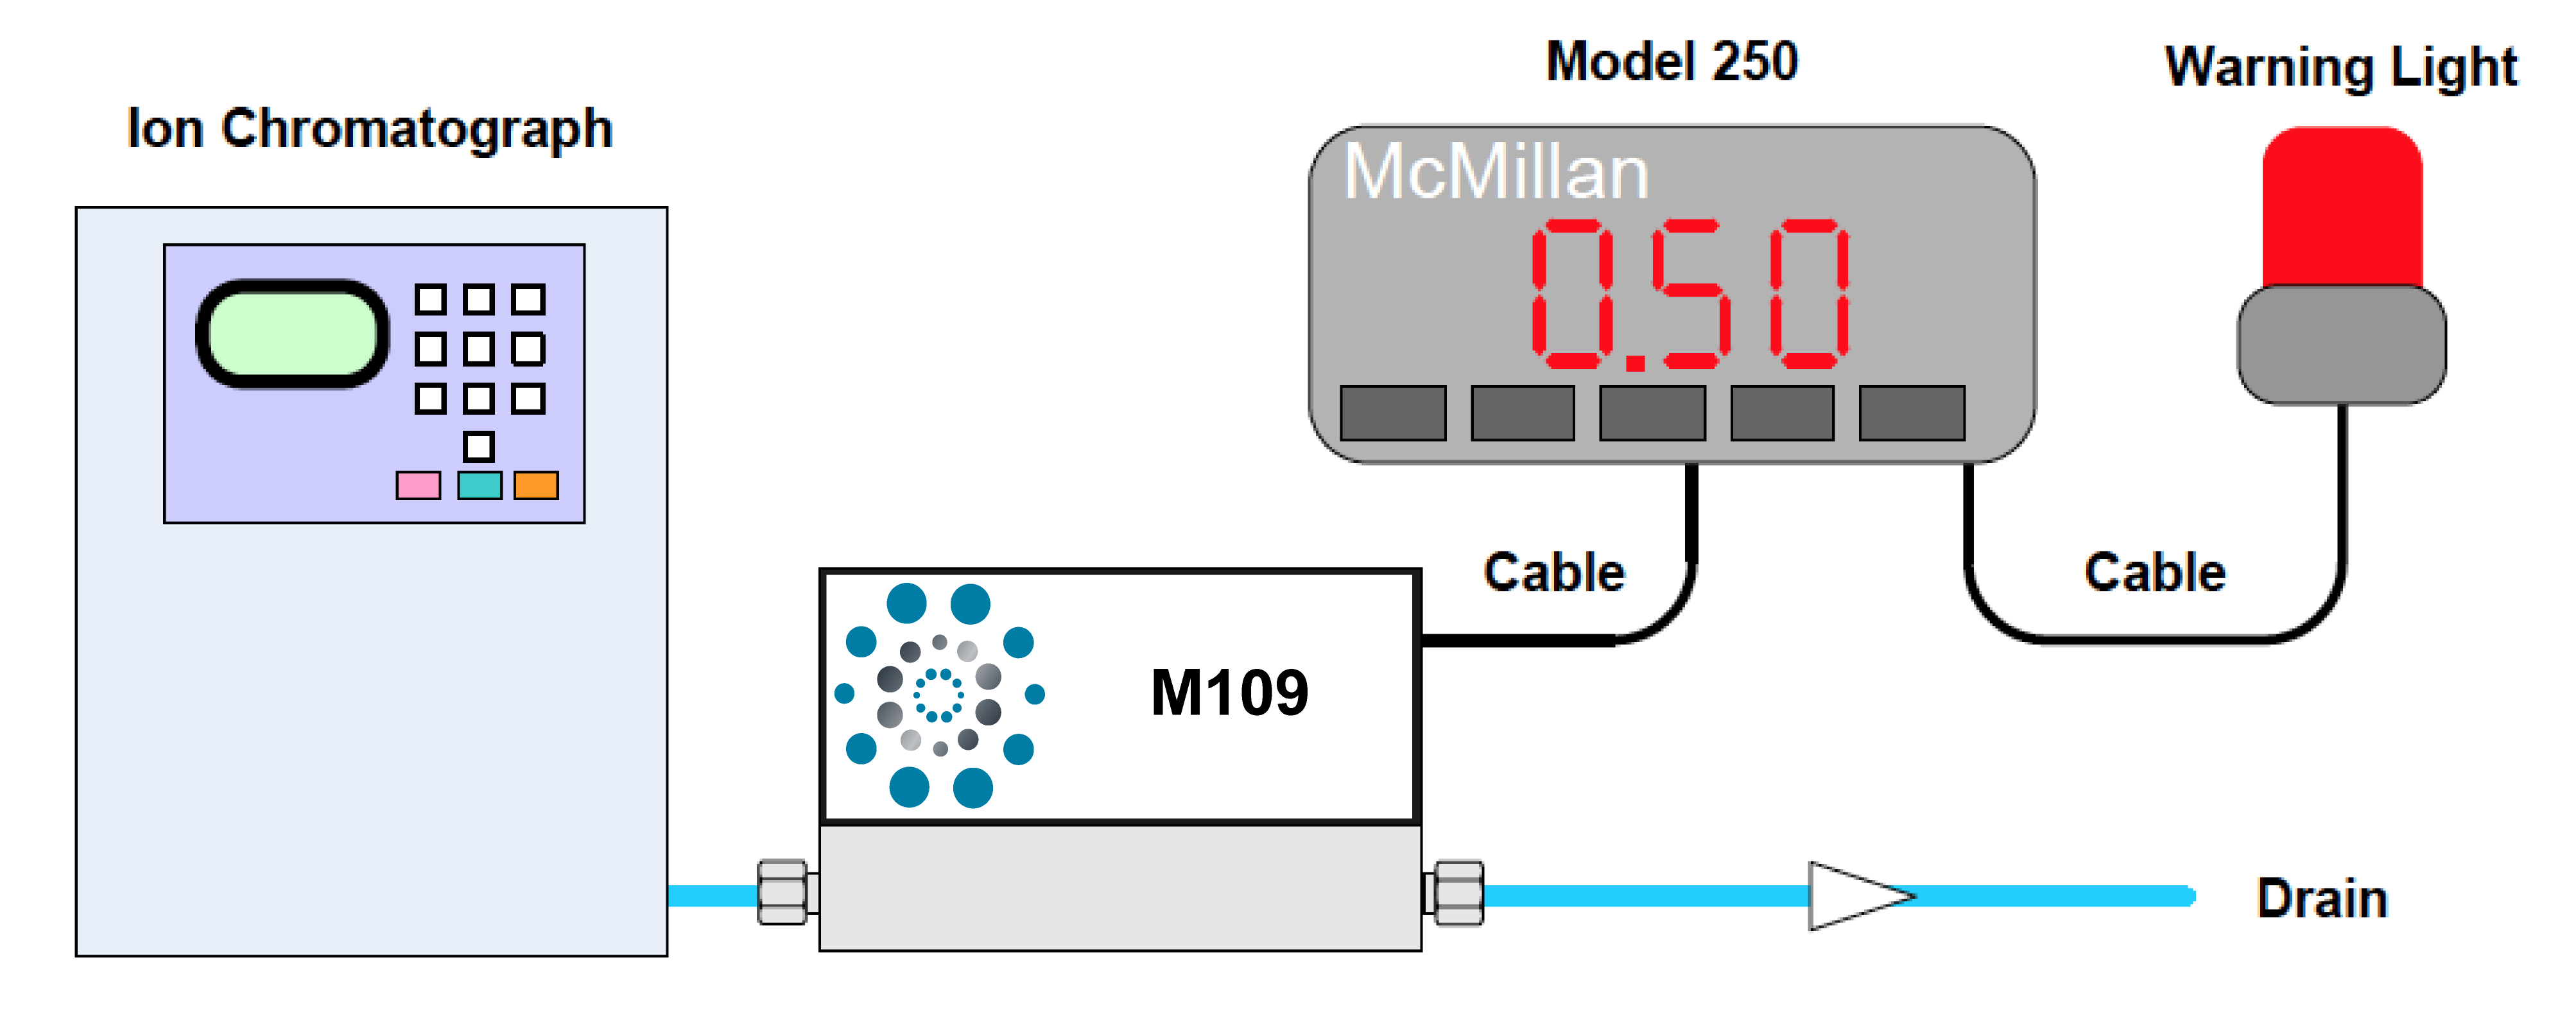
The waste stream is not visible to the operator, located in the rear of the machine. The M109 is located downstream of the IC and monitored by the Model 250. The Model 250 provides a visual indication of flow for the technician. An alarm will alert the technician or other staff members if flow is out of the specified range. The example shown will use a warning light as an alarm device.
ADVANTAGES
IC manufacturers equip their products with alarms for high/low pressure and leaks. McMillan M109 Liquid Flo-Sensor and 250 Multifunctional Display enhance protection by monitoring the waste stream flow. The combination of these products serves as a useful diagnostic tool for repairs, preventing damage to other components and reducing down time. It is also a cost effective solution, saving staff time, critical analysis data and lowering the use of consumables.
DIAGRAM
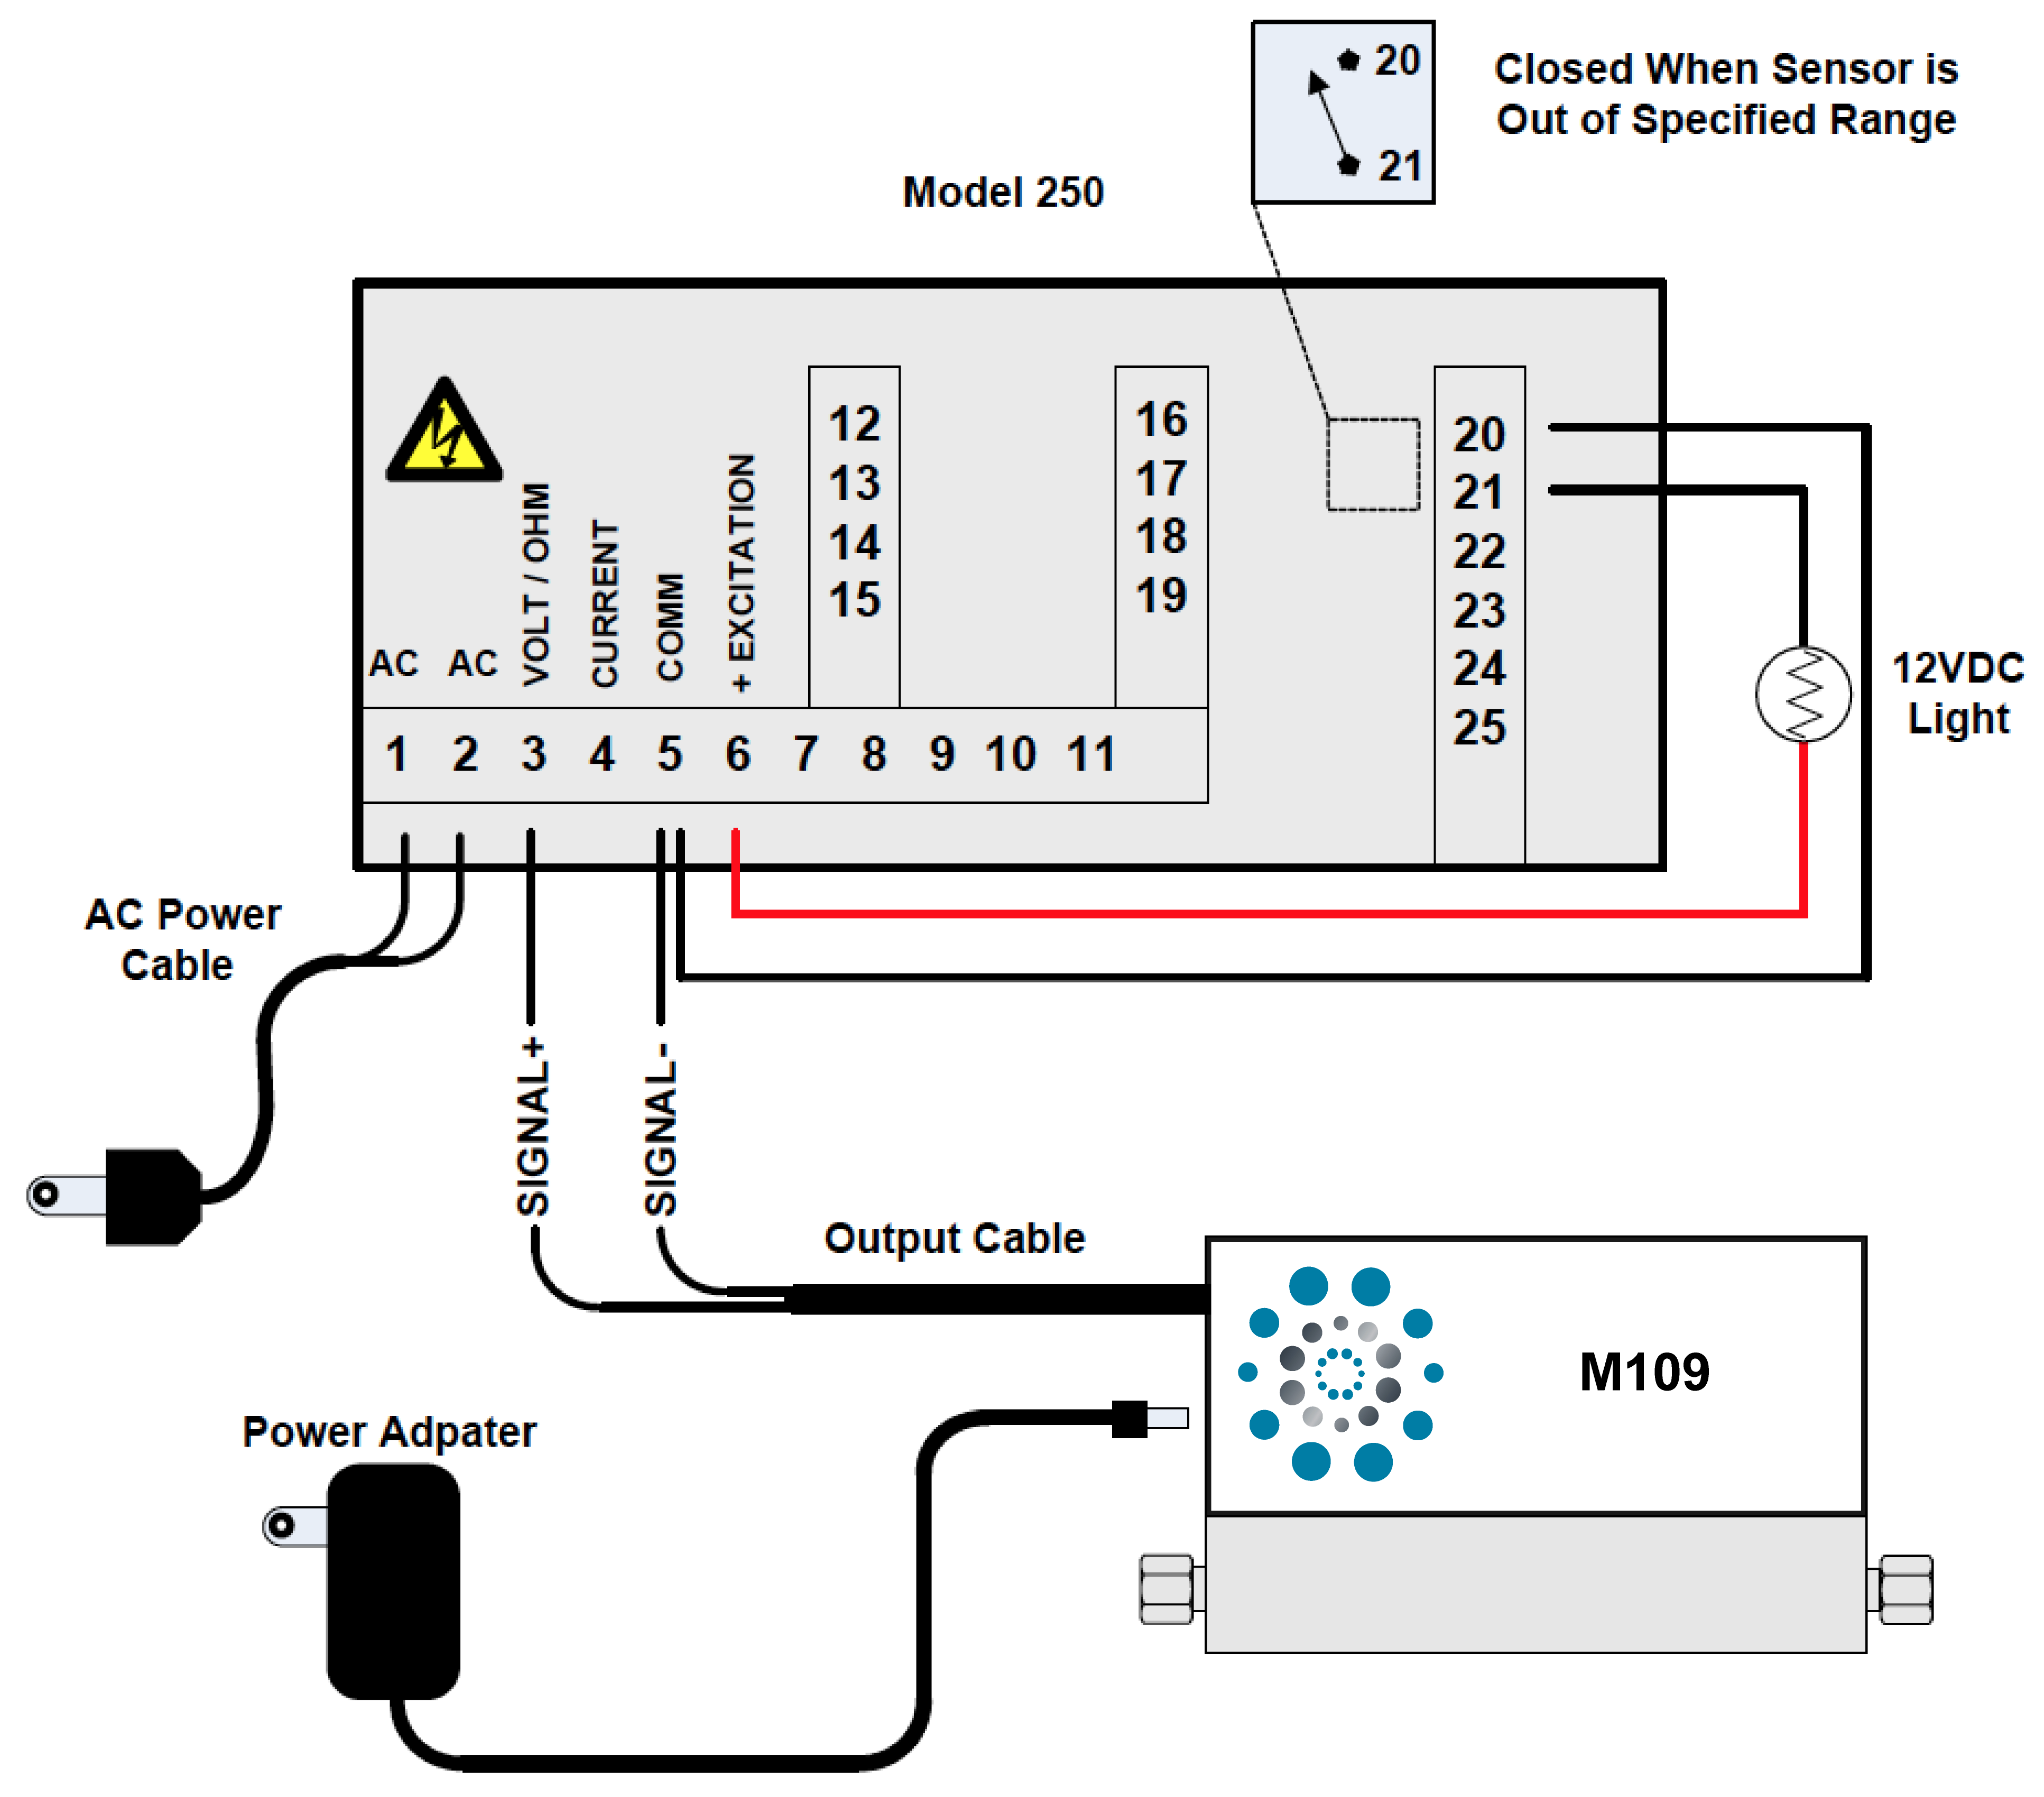
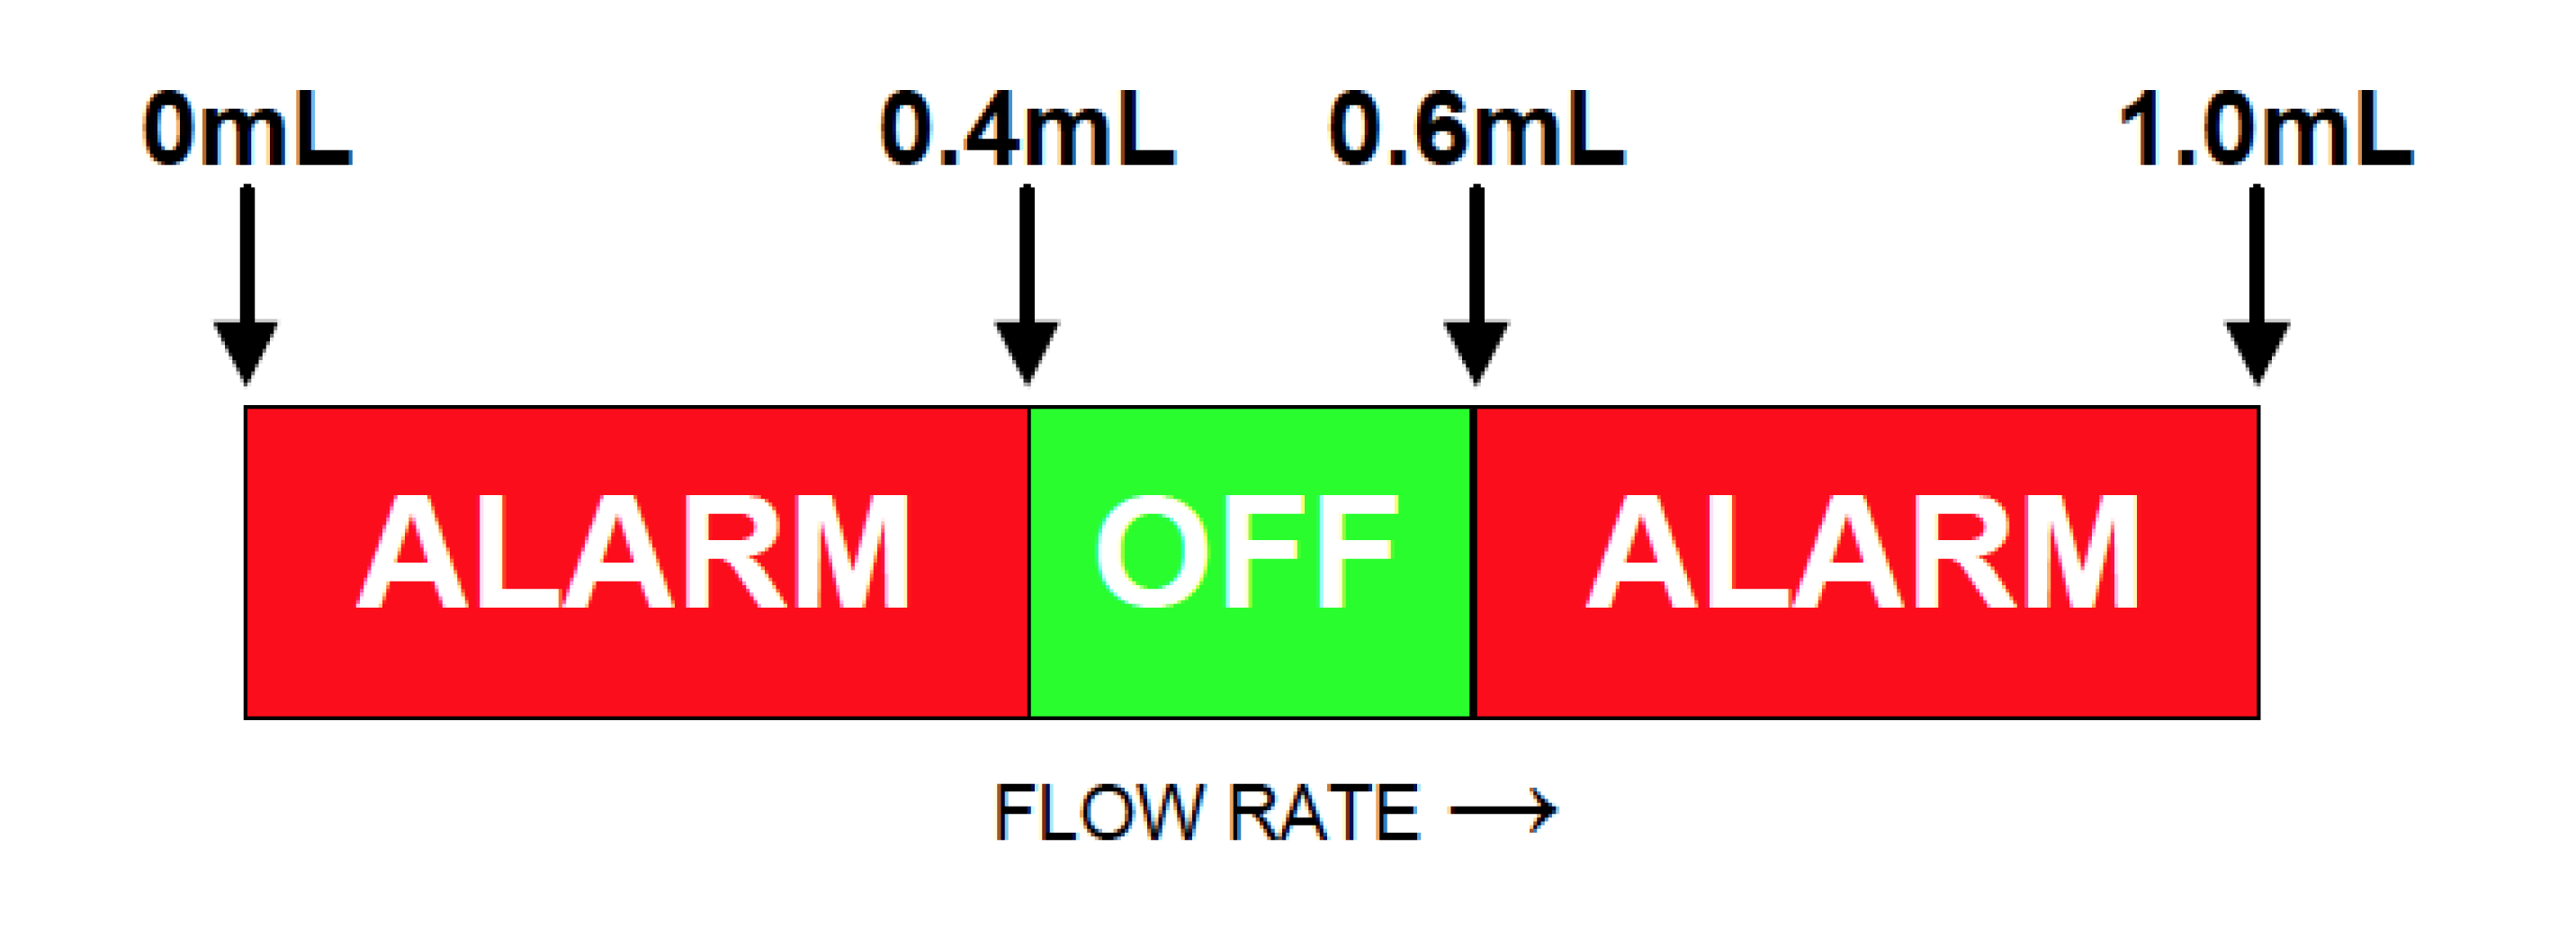
Figure 1 illustrates the flow path of the fluid system. Figure 2 illustrates the wiring of the system. Figure 3 illustrates the configuration of set points as programmed into the Model 250.
FIGURE 1 – Flow Path of Fluid System

FIGURE 2 – System Wiring

FIGURE 3 – Configuration of Set Points


